
From a Family Electronics Business to Digital Strategy: My View of Africa’s Tech Evolution

For more than two decades, our family business has operated within one of the most important economic shifts in African history: the rise of affordable mobile technology powered largely by Chinese manufacturing. Long before “digital transformation” became a global policy phrase, Chinese electronics brands were already transforming everyday African life from the ground up. In Uganda and across Africa, brands like Tecno, Itel, Infinix, and Redmi did something many Western companies failed to understand at the time: they built for the realities of the African consumer. They developed devices with: This was not simply about selling phones. It was the beginning of Africa’s modern digital infrastructure. China’s Role in Africa’s Digital Transformation The impact of China on Africa’s digital economy goes far beyond manufacturing. Chinese technology ecosystems accelerated: For millions of Africans, the first internet experience did not happen on a desktop computer. It happened on a Chinese-made smartphone. That single shift changed consumer behavior, communication patterns, business models, and even political discourse across the continent. Today, Africa’s digital economy is one of the fastest-growing in the world because mobile technology became accessible to ordinary people — not just elites. Watching Consumer Behavior Changed My Perspective Growing up around the electronics business exposed me to something deeper than retail. I became fascinated not only by the devices people bought, but by what happened after they turned them on. I started observing: That curiosity pushed me beyond phone sales. I wanted to understand the systems behind digital growth. I wanted to understand: That journey led me into web development, SEO, digital marketing, sales funnels, and startup advisory. Building Digital Infrastructure Beyond Hardware Over the years, I transitioned from simply participating in Africa’s electronics economy to helping businesses build their digital presence and growth infrastructure. Today, my work spans multiple areas of digital transformation. Website Development and Digital Presence I have spent years building and managing websites for businesses across different sectors, helping organizations move from offline visibility into fully functional digital ecosystems. This includes: I learned early that in Africa’s mobile-first economy, websites are no longer optional. They are commercial infrastructure. SEO and Search Visibility As smartphone usage increased, search behavior became one of the most powerful economic drivers in Africa. I specialized in SEO to help businesses: My work in SEO expanded into: This became especially important as African businesses increasingly sought visibility beyond local markets. Paid Media and Digital Advertising With over five years of experience in paid media and more than $12,000 spent in advertising campaigns, I have worked extensively with: This work helped businesses understand not only how to get traffic — but how to convert attention into revenue. Supporting African Entrepreneurship and Startups My involvement in digital transformation also expanded into startup ecosystems across Africa and the Middle East. Through engagements connected to organizations such as Doola based in USA and Flat6Labs, Startup Uganda, and International Trade Centre, I gained exposure to how emerging markets are building innovation ecosystems. This experience reinforced something important: Africa’s future will not only be shaped by technology consumers. It will be shaped by African builders. The Next Phase of Africa’s Digital Economy The next decade of African digital transformation will likely move beyond smartphone access into: China will continue to play a major role in this transformation through: But Africa itself is also evolving from being only a consumer market into a producer of digital innovation. Why This Matters Personally For me, this journey started in a phone business. But the phones became a gateway into understanding how technology reshapes human behavior, commerce, and opportunity. Watching customers move from: gave me a front-row seat to Africa’s digital evolution. That evolution inspired me to build skills and businesses that contribute directly to digital transformation rather than remaining only in retail distribution. Today, whether through SEO, web infrastructure, startup advisory, digital advertising, e-commerce systems, or content strategy, my work is centered around one idea: Helping African businesses and entrepreneurs compete effectively in a global digital economy. And in many ways, that journey began with a simple observation inside a family electronics business: Technology does not only change devices. It changes behavior, markets, industries, and the future of entire continents.
The $14,400 Question Every Service Business Needs to Answer About Their Software Stack

The Marketing Stack Audit: How to Calculate ROI & ROMI on Every Tool You Pay For .Most businesses have a software problem they don’t know they have. They are paying for 8, 10, sometimes 15 tools every month. Some of those tools are generating significant revenue. Some are sitting largely unused. Some are duplicating functions that another tool in the stack already covers. And almost none of the businesses paying for these tools have done the calculation that would tell them which category each tool falls into. The result: the average SaaS company uses 91+ tools in 2026, with at least 50% of SaaS licences underutilised or unused. Money that should be compounding into revenue is funding software subscriptions that are delivering no measurable return. This article is the framework for fixing that — specifically applied to the growth intelligence stack we use in every client audit: SEMrush, HubSpot, ClickFunnels, Leadpages, Apollo, Google Analytics, Google Tag Manager, Google Search Console, Hotjar, QuickBooks, and Kit (ConvertKit). Each tool has a job. Each tool has a cost. And each tool should be generating a return that justifies that cost — or it should be cut. The Two Metrics That Matter: ROI vs ROMI Before calculating anything, the definitions matter — because ROI and ROMI are measuring different things, and confusing them produces misleading conclusions. ROI (Return on Investment) measures the total return on any investment relative to its cost: ROI = (Revenue Generated − Total Investment) ÷ Total Investment × 100 If your total revenue is $200,000 and marketing spending is $50,000, then: $200,000 − $50,000 = $150,000 net profit. ROI = $150,000 ÷ $50,000 × 100 = 300%. For each dollar you spend on marketing, you earn $3 in profit. ROMI (Return on Marketing Investment) focuses specifically on marketing activities — isolating the return from marketing spend versus overall business investment: ROMI = (Revenue Attributable to Marketing − Marketing Investment) ÷ Marketing Investment × 100 ROMI focuses specifically on marketing activities and provides a more granular view of marketing effectiveness. If your company spent $50,000 on a campaign that generated $200,000 in revenue, ROMI = [($200,000 − $50,000) / $50,000] × 100% = 300%. For software stack analysis, you need both: The Full Software Cost Audit: What You Are Actually Spending Before calculating returns, you need an honest inventory of costs. Most businesses underestimate their software spend because they look at individual tools in isolation rather than the cumulative stack. Here is the Growth Intelligence Stack we use in client audits — with approximate monthly costs at standard tiers: Tool Function Est. Monthly Cost SEMrush SEO, keyword intelligence, competitive analysis $140–$500 HubSpot CRM, email marketing, sales pipeline $50–$800 ClickFunnels Funnel building, landing pages $97–$297 Leadpages Landing pages, lead capture $37–$99 Apollo Lead generation, prospecting, outreach $49–$99 Kit (ConvertKit) Email marketing, sequences, automation $29–$99 Hotjar Website heatmaps, session recordings $32–$80 Google Analytics Website traffic analysis Free Google Tag Manager Tag and tracking management Free Google Search Console Search performance monitoring Free QuickBooks Accounting, invoicing, financial tracking $30–$90 AWS / GoDaddy / Shopify / WordPress Hosting, e-commerce infrastructure $20–$300 Total (mid-tier estimate) ~$561–$2,463/mo At a mid-tier stack running $1,200/month, your software costs $14,400 per year before a single dollar of ad spend, freelancer cost, or your own time. That $14,400 is an investment. It needs to produce a return that justifies it — ideally a ROMI of at least 300%, which means $43,200+ in attributable revenue from that investment. The question every business should be asking: is it? How to Calculate ROI Per Tool The framework for calculating ROI on each tool in your stack has three steps: Step 1 — Assign Each Tool a Revenue Function Every tool in a growth stack should have a specific, measurable role in generating or protecting revenue. If you cannot articulate what revenue function a tool serves, that is a problem. SEMrush → Organic traffic growth → leads from organic search → revenue HubSpot → Lead capture, nurturing, CRM → conversion of leads to clients → revenue ClickFunnels/Leadpages → Paid traffic conversion → leads from paid ads → revenue Apollo → Outbound prospecting → booked calls → revenue Kit/ConvertKit → Email sequences → lead nurture → revenue Hotjar → Conversion rate optimisation → improved checkout/funnel performance → revenue QuickBooks → Financial management → invoicing accuracy, tax compliance → cost avoidance Google tools → Traffic measurement, search visibility → optimisation decisions → revenue Step 2 — Measure the Revenue Each Tool Contributes This requires attribution — connecting the revenue you generate to the tools that contributed to generating it. There are several approaches: multi-touch attribution assigns value to each marketing touchpoint in the customer journey. In practice, for most small and medium businesses, a simplified attribution model works: For SEMrush: Track organic traffic in Google Analytics. Calculate what percentage of your leads come from organic search. Apply that percentage to your revenue to get organic revenue. Compare to SEMrush’s monthly cost. For HubSpot: Track leads captured through HubSpot forms and sequences. Track which leads converted to paying clients. Calculate revenue from HubSpot-sourced clients. Compare to HubSpot’s monthly cost. For ClickFunnels/Leadpages: Track leads generated per landing page using UTM parameters and Google Analytics. Calculate conversion rate and revenue from those leads. Compare to platform cost. For Apollo: Track outbound sequences sent, replies received, calls booked, and clients closed. Calculate revenue from Apollo-sourced clients. Compare to Apollo’s monthly cost. For Kit/ConvertKit: Track email open rates, click rates, and — most importantly — revenue from email-triggered purchases or bookings. Compare to platform cost. For Hotjar: Calculate improvement in conversion rate since implementation. Apply conversion rate uplift to your traffic volume and average transaction value to estimate revenue impact. Compare to Hotjar’s monthly cost. Step 3 — Apply the ROI Formula Per Tool Tool ROI = (Revenue Attributed to Tool − Tool Monthly Cost) ÷ Tool Monthly Cost × 100 Example — SEMrush at $140/month: Example — Apollo at $49/month: These numbers illustrate why high-performing tools deserve more investment
Dubai vs Bahrain: Where Should You Buy Property in 2026 — And Which Gets You a Golden Visa?

Two properties. Two Gulf markets. Two completely different investment outcomes. The first is a furnished 1-bedroom apartment in Hamza Tower, Dubai Sports City — 873 square feet, already tenanted, listed at AED 820,000 ($223,000). The second is a 1-bedroom apartment in Al Juffair, Bahrain’s Capital Governorate — 657 square feet, listed by ERA Real Estate at 41,000 BHD ($108,730). Both are in freehold zones. Both are in USD-pegged currency markets. Both are in established residential areas with consistent expat demand. But when you run the full comparison — purchase price, rental yield, net return, Golden Visa eligibility, and 10-year investor outcome — the picture is considerably more nuanced than the headline numbers suggest. This is the comparison every East African, South Asian, and emerging market investor looking at Gulf real estate needs to read before committing capital in 2026. The Properties: What You Are Actually Buying Property A — Hamza Tower, Dubai Sports City, UAE Hamza Tower is a completed 16-storey residential building in Dubai Sports City, DubaiLand. The specific unit — an upgraded, furnished 1-bedroom on a mid-floor — is listed at AED 820,000 ($223,000) and is already rented, meaning day-one rental income for the buyer. Hamza Tower carries an 8.9% rental yield according to Property Finder data, one of the stronger yield profiles in Dubai Sports City. Real estate in Dubai Sports City has a return on investment rate of 8.4%, which is competitive compared to premium Dubai locations like Downtown or Palm Jumeirah that offer 4–6% but stronger capital appreciation. Average rental value of Hamza Tower apartments is AED 72,124 per annum, translating to approximately AED 6,010 ($1,635) per month — with new rentals averaging AED 55,108/year and renewed rentals averaging AED 43,881/year. Property B — Al Juffair, Capital Governorate, Bahrain The Bahrain property is a 1-bedroom apartment of 657 square feet in Al Juffair — Manama’s most consistently performing residential district — listed by ERA Real Estate at 41,000 BHD ($108,730) at a price per square foot of 62 BHD. Al Juffair’s structural advantage is well-documented: it sits adjacent to the US Naval Support Activity Bahrain — the largest American military installation in the Middle East — creating permanent, structural demand from military personnel, contractors, and the expat professional community. Demand in this district replenishes regardless of broader economic cycles. Estimated monthly rent for a standard long-term tenancy: 300 BHD ($795). Annual income: 3,600 BHD ($9,540). Gross yield: 8.78%. The ROI Comparison: Running the Real Numbers Purchase Price The most important number in any yield comparison is the denominator — what you paid. Dubai Hamza Tower Bahrain Al Juffair Purchase price AED 820,000 ($223,000) 41,000 BHD ($108,730) Price gap Dubai costs $114,270 more The Dubai property costs more than twice what the Bahrain property costs. Every yield percentage is calculated against that base — which means the absolute capital at risk is fundamentally different. Rental Income Metric Dubai Bahrain Monthly rent ~AED 6,010 ($1,635) 300 BHD ($795) Annual rent ~$19,620 $9,540 Already tenanted ✅ Yes ❌ No Dubai generates more absolute rental income — approximately double Bahrain’s monthly figure. This is the Dubai property’s primary advantage. If your objective is maximum rental income from a single asset, Dubai delivers more cash. Yield Analysis Metric Dubai Bahrain Gross yield 8.7% (DLD-registered data) 8.78% DLD transfer fee 4% ($8,920) ~1.7% ($1,848) Agency commission ~2% ($4,460) ~2% ($2,175) Annual service charge AED 10–50/sqft/year Lower Net yield (after costs) ~5.5–6.5% ~7–8% Currency peg ✅ AED/USD ✅ BHD/USD Both currencies are USD-pegged — zero currency conversion risk for dollar-benchmarked investors. On gross yield, the properties are virtually identical at approximately 8.7–8.78%. On net yield, Bahrain pulls ahead because its transaction costs are significantly lower — Dubai’s 4% DLD transfer fee alone costs $8,920 on this property, versus approximately $1,848 in Bahrain’s equivalent fees. 10-Year Projection Dubai Bahrain Capital invested $223,000 $108,730 Annual net rental income ~$13,000 ~$8,200 10-year rental total ~$130,000 ~$82,000 Capital saved vs Dubai — +$114,270 Total 10-year position $130,000 income $82,000 income + $114,270 saved Net advantage — +$66,270 ahead The capital efficiency calculation flips the comparison entirely. The $114,270 you don’t spend buying Bahrain instead of Dubai — invested conservatively at 6% annually — compounds to approximately $204,000 over 10 years. The rental income gap ($130,000 vs $82,000) is $48,000 in Dubai’s favour. But the capital efficiency advantage of $114,270 more than compensates — leaving the Bahrain investor materially ahead over a 10-year horizon. The Golden Visa: Where the Real Difference Is This is where the comparison fundamentally changes — and where every investor needs to pay close attention to what has changed in 2026. Dubai Golden Visa — What This Property Actually Qualifies For Dubai has reset criteria for its two-year property-linked residency visa, removing the minimum property value requirement for sole owners. This means the AED 820,000 Hamza Tower apartment qualifies for a 2-year investor visa — renewable, but requiring reapplication every two years. The 10-year Golden Visa requires a minimum AED 2 million investment — approximately $545,000. At AED 820,000, this property falls significantly short. To qualify for Dubai’s 10-year Golden Visa through property, you would need to purchase approximately 2.4 additional properties of this value — a combined investment of approximately $535,000. Dubai Golden Visa summary for this property: Bahrain Golden Residency — What This Property Qualifies For Bahrain reduced its minimum real estate investment for the Golden Residency visa to BHD 130,000 ($345,000), down from BHD 200,000. The programme, launched in 2022, offers a 10-year renewable residence permit with work rights and family reunification. The Al Juffair apartment at 41,000 BHD ($108,730) does not on its own meet the BHD 130,000 threshold. However — and this is the critical investment insight — purchasing three apartments of this type (3 × 41,000 BHD = 123,000 BHD) comes within reach of the threshold, and combining with any additional qualifying property crosses it. Alternatively, the BHD 130,000 threshold can be met through a single higher-value property or a portfolio of properties whose combined value
Bahrain vs Kampala: Where Should East Africans Invest in Property in 2026?
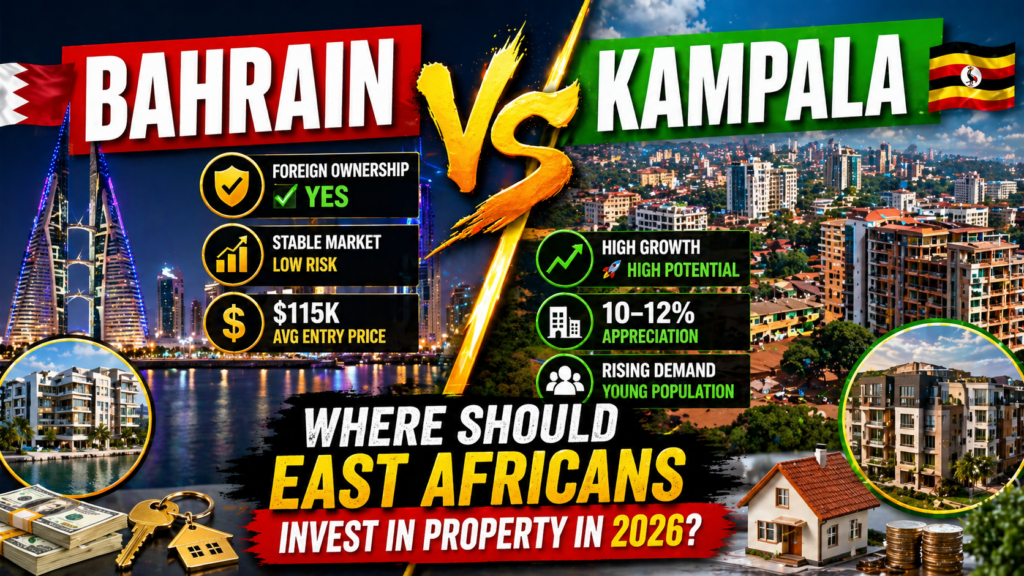
A growing number of East African investors are asking the same question in 2026: should I buy property at home or in the Gulf? It is a legitimate question. Kampala’s luxury residential market is attracting serious international developers. VAAL Real Estate — a Turkish-Egyptian firm with projects in Kenya, Ghana, the UK, and the Middle East — has committed $30 million to Cadenza Residence, a 24-storey tower in Nakasero that will be one of the tallest buildings in Uganda when it completes in July 2027. At the same time, Bahrain’s Al Juffair district is offering 1-bedroom apartments at 41,000 BHD — approximately $108,730 — in a market with proven yields, dollar-pegged currency, and one of the most liquid residential markets in the Gulf. Both look compelling on paper. The numbers, however, tell a more specific story. This is an honest, data-driven comparison of two real properties currently available to investors — not a promotional piece for either market. The Properties Property A — Bahrain, Al Juffair Property B — Uganda, VAAL Cadenza Residence The first and most significant data point: Uganda costs $35,270 more for a comparable 1-bedroom unit — before a single month of rent is collected. The Rental Income Reality Bahrain — Al Juffair Al Juffair is one of Bahrain’s most consistently performing rental districts. It sits adjacent to the US Naval Support Activity base — the largest US military installation in the Middle East — which creates permanent, high-quality tenant demand from military personnel, contractors, and the expat professional community that clusters around it. The rental market here is not speculative. It is structural. Demand replenishes itself regardless of broader economic cycles because the base and Bahrain’s financial sector create a continuous inflow of tenants. For the 41,000 BHD 1-bedroom apartment: monthly rent of 300 BHD ($795) is the market-rate figure for this property type and location — conservative relative to what fully furnished units achieve, but realistic for a standard long-term tenancy. Annual rental income: 3,600 BHD ($9,540)Gross yield on purchase price: 8.78%Net yield after costs and 10% municipal tax: ~7–8% Uganda — VAAL Cadenza Nakasero is Kampala’s most prestigious address. Neighbouring several embassies, the Parliament, State House, and the United Nations offices, it commands the highest rents in the city for luxury residential stock. The market data for prime Kampala 1-bedrooms in early 2026 shows a realistic range of 2,500,000 to 4,500,000 UGX per month ($685–$1,245) for fully serviced furnished units targeting expats and diplomats. For a luxury new-build like Cadenza — with amenities including a heated swimming pool, gym, business centre, and full generator backup — the upper end of this range is achievable in the right conditions. However, two market realities temper this optimism: First, prime Kampala has a vacancy rate of 15–22% in the luxury segment. Tenants in Nakasero and Kololo have strong negotiating power because supply has outpaced demand in recent years. A unit that achieves 4,500,000 UGX when occupied may sit empty for two to three months per year. Second, Cadenza does not complete until July 2027. An investor purchasing today earns zero rental income for at least 14 months — while the Bahrain apartment generates returns from day one. Using a realistic furnished rate of 3,500,000 UGX ($960/month) with an 18% vacancy adjustment: Effective monthly income: ~$787Annual rental income: ~$9,444Gross yield on $144,000: ~6.6%Net yield after vacancy, tax (12% on gross above threshold), and costs: ~4–5% The 10-Year Numbers Conservative Projection Metric Bahrain 41K BHD VAAL Cadenza Uganda Purchase price $108,730 $144,000 Monthly rent $795 $960 (optimistic) Vacancy adjustment 0% (structural demand) 18% (market rate) Effective monthly income $795 $787 Annual income $9,540 $9,444 10-year gross rent $95,400 $94,440 Capital saved vs Uganda +$35,270 — 10-year total advantage +$36,230 ahead — The result is striking: even taking Uganda’s best-case furnished rent — higher than Bahrain’s monthly figure — Bahrain still produces a superior 10-year outcome because the $35,270 price difference never closes. That $35,270 invested separately at a conservative 6% annual return compounds to approximately $63,000 over 10 years. The capital efficiency gap between these two investments is not marginal. The Risk Factors Nobody Puts in the Brochure Currency Risk Bahrain’s dinar is pegged to the US dollar at a fixed rate of 0.376 BHD to $1 — a peg that has held since 1987 and is backed by Gulf Cooperation Council reserves. An East African investor buying in Bahrain has zero currency conversion risk on their dollar-denominated returns. Uganda’s shilling has depreciated against the dollar consistently over the past decade. A rental income of 3,500,000 UGX that translates to $960 today may translate to $880 in three years and $800 in five if historical depreciation trends continue. The investment thesis that looks compelling in UGX terms erodes in USD terms over time — which matters enormously for any investor benchmarking returns in dollars. Vacancy Risk Juffair’s vacancy rate for 1-bedroom apartments is structurally low. The combination of US Navy presence, corporate expat demand from Bahrain’s financial sector, and proximity to Manama’s central business district creates consistent occupancy. Units in well-maintained buildings here lease within days, not months. Prime Kampala luxury stock, by contrast, has vacancy rates of 15–22%. This is not a temporary market condition — it reflects the fundamental affordability constraint of the Ugandan market. The pool of tenants who can afford $900–$1,200 per month in Kampala is small and highly competitive to access. Cadenza will compete with every other premium development in Nakasero for a limited number of qualifying tenants. Completion Risk VAAL Cadenza is scheduled to complete in July 2027. Construction timelines in emerging markets carry inherent risk. A delay of six to twelve months — not uncommon in large-scale residential developments — extends the period of zero rental income and increases carrying costs for investors who have borrowed to finance the purchase. Bahrain carries no completion risk. The property is built, titled, and available to lease immediately. Resale Liquidity Bahrain’s property market is one of the most liquid in the Gulf for foreign
Why Gulf Real Estate Companies Are Losing Leads Online in 2026(And How to Fix It)

Gulf real estate businesses spend more on digital marketing per lead than almost any other sector in the region. They run Google Ads. They post on Instagram. They sponsor influencers. They list on every property portal. Some of them have marketing budgets that would be considered generous by international standards. And yet — most of them are converting a fraction of the leads they should be generating. This is not a spend problem. It is a system problem. And it repeats across the GCC with enough consistency that the leaks are identifiable, predictable, and fixable. Why Gulf Real Estate Is Different Before diagnosing the leaks, it is worth understanding why real estate in the Gulf creates a uniquely complex digital marketing challenge. The buyer journey is long. A client buying a property in Bahrain, Dubai, or Riyadh may research for weeks or months before making first contact. They visit multiple platforms, compare multiple developments, engage with multiple agents — and then go quiet. Re-engaging them requires a system. Most agencies don’t have one. The transaction value is high. A single closed deal in Gulf real estate can be worth tens or hundreds of thousands of dollars. This means the economics of lead generation are entirely different from a business selling a $50 product. A $200 cost per lead that produces one $200,000 sale is exceptional ROI. Most real estate marketing teams are not thinking about it this way — they are focused on volume rather than quality. Trust is the primary conversion driver. Gulf buyers — particularly for high-value residential and commercial property — do not make decisions based on an ad alone. They make decisions based on a combination of brand trust, agent credibility, local market knowledge, and peer validation. Digital marketing that doesn’t build trust — that focuses only on driving enquiries — produces low-quality leads that rarely convert. The 5 Biggest Revenue Leaks in Gulf Real Estate Marketing Leak 1: Ads Driving Traffic to Generic Portals Instead of Owned Landing Pages Many Gulf real estate agencies run Google Ads or social media campaigns that direct traffic to property portals — Bayut, Property Finder, or similar — rather than to their own website or landing pages. This is an expensive mistake. When you pay for a click that lands on a portal, you are paying to drive traffic to a platform that also shows your competitors’ listings. The buyer may submit an enquiry — but it goes to multiple agents simultaneously. Your paid traffic is subsidising your competition. Owned landing pages — specifically designed for the property or development being advertised, with a single clear call to action — consistently outperform portal referrals for quality of lead. The buyer who submits their details on your landing page is contacting you. Not three other agents. Leak 2: No Conversion Tracking on Ad Spend This is the most expensive and most common leak. Gulf real estate businesses spending $5,000–$20,000/month on Google Ads frequently have no reliable conversion tracking in place. Without conversion tracking, you do not know which campaigns, which keywords, and which ad creatives are generating actual leads versus just clicks. You are making budget decisions based on assumptions — and those assumptions are almost always wrong. The fix requires Google Tag Manager, properly configured conversion events, and integration with your CRM. Once you can see which keyword or ad produced each lead, optimisation becomes straightforward. Without it, you are optimising blind. This is covered in full as part of a proper digital marketing diagnostic. Leak 3: Leads Falling Into a CRM Black Hole A lead that is not followed up within 30 minutes in Gulf real estate is significantly less likely to convert. Buyers who enquire — particularly on a property portal or via a paid ad — are often simultaneously submitting enquiries to multiple agents. The first credible, professional response has a disproportionate conversion advantage. Most Gulf real estate agencies do not have an automated lead follow-up sequence. A lead comes in by email or WhatsApp, gets manually forwarded to an agent, and the response time depends entirely on whether that agent is available and diligent. A properly configured CRM — with automated WhatsApp or email responses sent within minutes of lead submission, followed by a structured nurturing sequence — can recover a significant percentage of leads that currently go cold. The revenue sitting in unconfigured CRM systems in Gulf real estate agencies is substantial. For a broader look at what a revenue leak is and how to find yours, the principles apply directly here. Leak 4: Instagram and Facebook Ads Targeting the Wrong Audience Social media advertising for Gulf real estate is often targeted too broadly or with the wrong creative-to-audience match. A common mistake: running the same luxury property ad creative to a broad UAE or Bahrain audience regardless of income signal, purchase intent, or nationality. Gulf real estate buyers are highly segmented. An off-plan investment buyer has entirely different motivations and triggers than an expatriate family searching for a rental. A GCC national buying a primary residence behaves differently from a foreign investor seeking yield. Segmented campaigns — with creatives, messaging, and calls to action tailored to each audience type — consistently outperform broad targeting approaches. This requires more upfront creative work but delivers materially better CPLs and conversion rates. Leak 5: SEO Completely Neglected in Favour of Paid Channels Paid ads produce immediate visibility. This makes them psychologically satisfying and easy to justify in a budget conversation. But they stop working the moment the budget stops. Gulf real estate agencies that invest exclusively in paid channels and neglect organic search are building on rented land. A competitor who invests consistently in SEO — building topical authority around property types, locations, and buyer questions — will accumulate a compounding visibility advantage that cannot be easily replicated or outspent. In most Gulf property categories, organic search competition is still low enough that a 12–18 month SEO investment can establish a position that generates leads